Denmark Tracks Migrants’ Fiscal Contributions and Costs
Official Danish statistics reveal stark differences in immigrants’ fiscal impact. While many groups from Western countries make a positive contribution to public finances, migrants from Middle Eastern and North African countries, Pakistan and Turkey impose high net costs.
Danish Finance Minister Peter Hummelgaard, whose ministry has published detailed data on the fiscal impact of immigration. Photo: Kristian Tuxen Ladegaard Berg/NurPhoto via Getty Images
|
Statistics released by the Danish Finance Ministry have attracted international attention. They show how much immigrants from different countries of origin contribute on average to Denmark’s public finances or, conversely, how much they cost the state on a net basis.
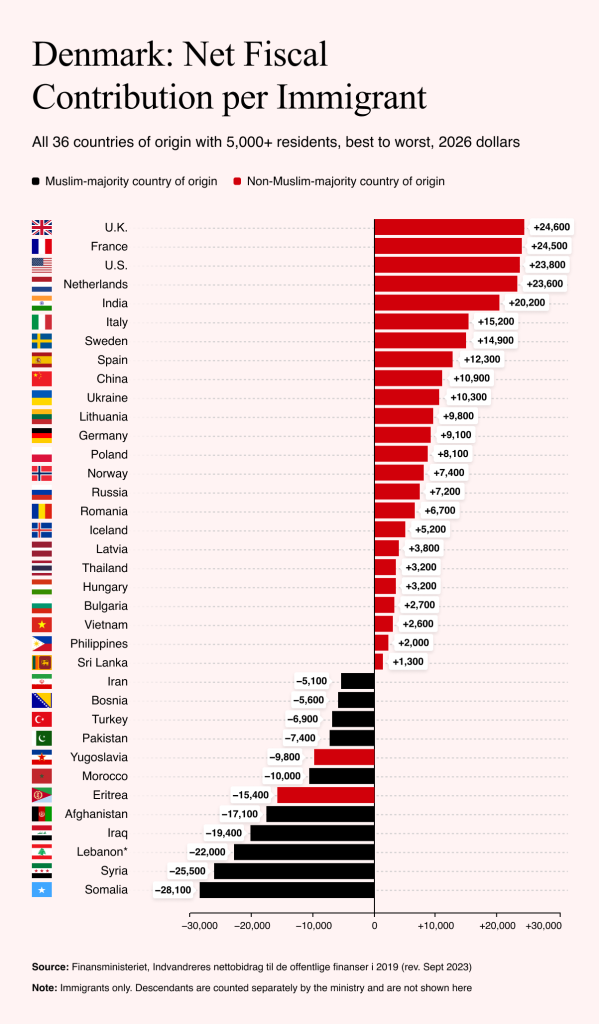
On the social media platform X, users distilled the figures into a striking claim: of immigrants from 26 "non-Muslim" countries of origin, 24 represented a net gain for taxpayers, while immigrants from all 10 "Muslim" countries cost the state money. The figures are based on 2019 data and come from a Finance Ministry study published in 2023.
Source: Danish Ministry of Finance
Particularly striking is the chart from the study, in which the ministry compares the average annual net contribution of immigrants from 36 countries of origin. It includes only countries from which at least 5,000 people were living in Denmark throughout 2019. The net fiscal balance for each country includes taxes and contributions on one side and government transfers and public services on the other. The results differ dramatically by country of origin.
A Defensible Interpretation
Among immigrants from Somalia, the average net contribution was around minus DKr130,200 ($20,400) per person per year. For Syrians, it was minus DKr118,100 ($18,500) while Lebanese immigrants recorded minus DKr102,000 ($16,000), Iraqis minus DKr90,000 ($14,100) and Afghans minus DKr79,100 ($12,400). Moroccans, Pakistanis, Turks and Iranians were also well into negative territory. Bosnians recorded around minus DKr26,100 ($4,100).
At the other end of the scale, immigrants from the UK recorded around plus DKr114,000 ($17,800) per person per year. Those from France recorded plus DKr113,600 ($17,800), those from the US plus DKr110,400 ($17,300) and those from the Netherlands plus DKr109,500 ($17,100). Indians, Italians, Swedes, Spaniards, Chinese, Ukrainians, Germans and Poles also recorded positive figures.
Mathematically, the claim made on X can indeed be derived from the chart. Of the 36 countries listed, 12 are in negative territory. Nine belong to Denmark’s official Middle Eastern, North African, Pakistani and Turkish (MENAPT) category in the chart: Somalia, Syria, Lebanon, Iraq, Afghanistan, Morocco, Pakistan, Turkey and Iran.
If Bosnia-Herzegovina is also counted among Muslim-majority countries, this produces the 10 Muslim countries cited in the post. The other two countries in negative territory are Eritrea and Yugoslavia. The latter no longer exists but is still listed separately for statistical purposes. The remaining 24 countries are all in positive territory.
Striking Patterns
The phrase "all Muslim countries cost money" does not, of course, come from the Danish Finance Ministry. The ministry categorizes immigrants by origin, not by religion. The religious classification was imposed on the official data by the authors of the viral post. Nevertheless, the interpretation reflects a real pattern in the figures.
When countries of origin are grouped by region, the pattern is similarly pronounced. According to the calculations, immigrants and descendants from MENAPT countries generated net government expenditure of around DKr24bn ($3.8bn) in 2019.
Immigrants and descendants from Western countries, by contrast, made a positive net contribution of around DKr11bn ($1.7bn). Other non-Western countries outside MENAPT recorded a negative net contribution of around DKr3bn ($470m). Overall, immigrants and their descendants generated net costs of around DKr16bn ($2.5bn).
The statistics, however, are considerably more comprehensive than a simple comparison of welfare benefits and income tax. The Finance Ministry attempted to allocate all public revenue and expenditure to individual residents. This includes directly attributable taxes and transfer payments as well as spending on health and education, along with collectively funded services such as roads, public transportation and defense.
The Ministry’s Explanations
The ministry identifies the reason for immigration as an important factor in explaining the differences. Labor migrants are far more likely to make a positive fiscal contribution than refugees or certain groups arriving through family reunification.
The ministry therefore used a model to examine what would happen if MENAPT immigrants had the same distribution of reasons for residence as Western immigrants. Their average net contribution would then be around DKr60,000 ($9,400) higher per person, although it would still remain negative on average.
Age also plays a considerable role. Children, young people and older people are typically net recipients of public services regardless of their origin, while people of working age are more likely to make positive contributions. The statistics are therefore a snapshot of public finances in a particular year. They are not evidence that religion itself causes the observed differences. Such an assumption would go beyond what the statistics show.
Further Analyses in Other Countries
In Denmark, the costs and benefits of migration are regularly examined by various organizations. In 2025, for example, the employers’ association Dansk Arbejdsgiverforening published an estimate based on the Finance Ministry’s methodology. It found that international workers, including accompanying family members, make an annual positive contribution to public finances of around DKr26.7bn ($4.2bn).
Similar studies exist in the Netherlands, Norway, Belgium, Germany and the UK. They are comparable in that they likewise weigh taxes and contributions paid by immigrants against government spending on transfers and public services. They repeatedly show that labor migration and immigration from European or Western countries tend to produce more favorable fiscal outcomes than refugee, family or other forms of migration from non-EU countries.
The categories and calculation methods used, however, are only partly comparable. Germany distinguishes primarily between EU and non-EU foreigners, Norway uses broad regions of origin, Belgium distinguishes between EU and non-EU origin, and the UK increasingly categorizes migrants by visa and immigration route.
The Dutch study comes closest to the Danish analysis because it differentiates in detail by origin and reason for immigration. It is not, however, an official government statistic and in some cases calculates lifetime effects.
According to the authors, the Dutch study was prompted primarily by the fact that, despite the political significance of the sharp increase in immigration, its fiscal impact had barely been examined systematically since a government study published in 2003.
Denmark therefore occupies a special position. The Finance Ministry officially publishes the annual net fiscal contribution for 36 individual countries of origin. The central finding of the Danish data remains that there are striking fiscal differences between groups of different origins. In the official calculation, MENAPT immigrants and their descendants accounted for almost all the net costs of non-Western migration, while Western immigration reduced the overall burden on the state budget.
Unlike many other countries, Denmark lays its cards on the table, publishing figures that other states do not disclose in the same way.